

What We do?
Robinhood stopped distributing its popularity data in August 2020. This data was very popular not only with journalists and retail investors, but also with professionals. The good news is that we developed a viable alternative and proxy for retail investors popularity data.
Our customers can benefit from our retail popularity data proxy that provides real time estimates of retail sentiment and retail popularity. We focus on identifying those stocks that have the highest estimated values.
Our retail popularity estimates are based on several publicly available, free sources. These also include developments in certain subreddits and specific subspaces on Twitter. Our methodology includes: (1) advanced text sentiment analysis, which includes any specific community’s language usage; (2) determination of the frequency of company and ticker mentions; and (3) aggregation and evaluation of the community's reactions using various metrics. While we offer feeds focused on individual sources, especially beloved is our aggregate feed that combines, via our proprietary process, retail-related data across dozen of publicly available, free sources. We deliver data and analytic via API and dashboards and also provide pre-market email alerts and insights.
Our data is updated 24/7 with more chatter collected typically during US market hours. Depending on client's needs, we deliver via dashboards, email notifications, API and EOD files.
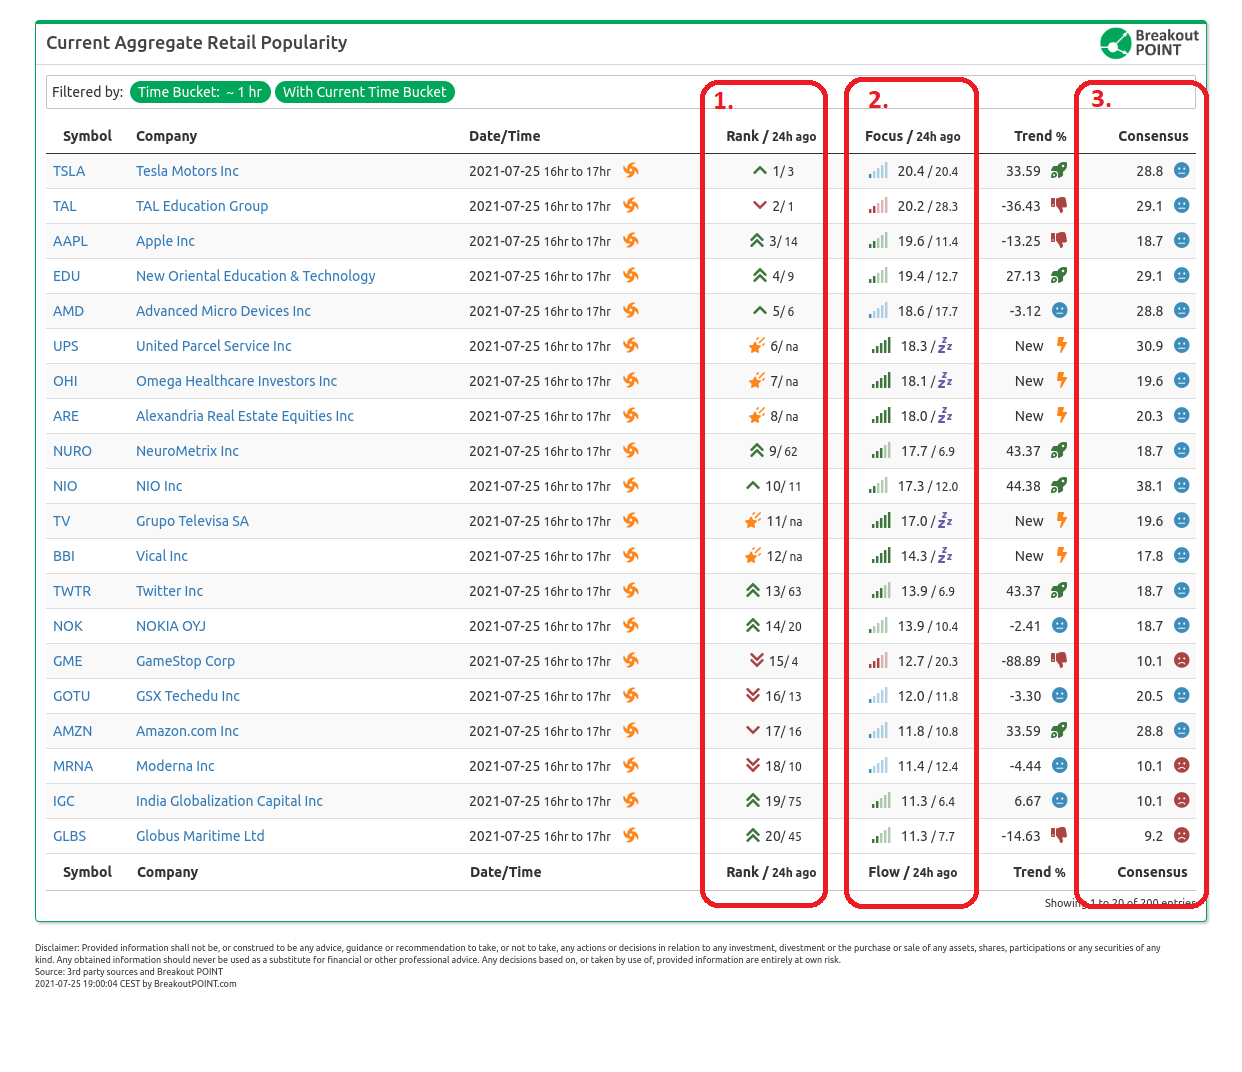
When it comes to our aggregate retail popularty feed, the collected data is analyzed and the result is a list of estimated most popular retail tickers (1."Rank") and two additional metrics. These two metrics are: the level of retail interest (2."Retail Focus") and amount of consensus across analyzed dozen sources (3."Retail Consensus").
Retail Popularity Metrics
1. Rank
"Rank" is our composite real-time estimate of the popularity of a particular ticker. It combines popularity of a ticker from each of individual sources. "Rank" is our proxy for ranking the tickers that have the highest popularity change at Robinhood.
Lower numbers denote more popular stocks.
2. Retail Focus
"Retail Focus" (sometimes dubbed "Retail Flow" on our dashboards) assesses the overall interest and activity of retail investors in a particular ticker, regardless of the underlying consensus. Sometimes, despite a broad consenus, the overall Retail Focus may not be very high, indicating that ticker while omni-present is not among the top trending tickers on individual sources. Values from 0 to 100 are possible. Higher values represent a higher aggregate retail investors focus/interest in the company and correspond to companies with the lower Rank.
3. Retail Consensus
With "Retail Consensus" metric, we show how broadly a particular ticker is currently trending among retail investors. Values from 0 to 100 are possible. Higher values represent a broader retail investors consensus about the company. Consensus 100 means that ticker is omni-present on analysed sources, Even tickers with Consensus of 100, might not be tickers with the highest Rank, as some other tickers might be trending at higher spots on individual sources and yet not be present at all sources.
Use Cases
Here are some use cases, where our retail popularity data and analytics helped our users (contact us for more details):
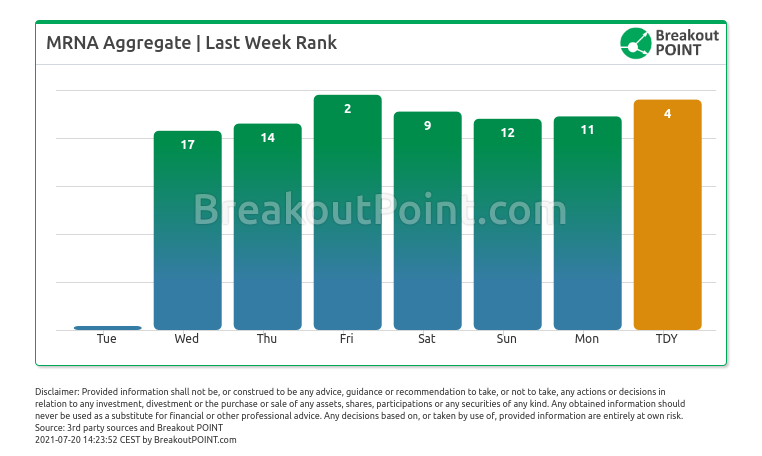
- Jul'21: Focus on Moderna (MRNA). As the focus on Covid-stocks returned in July 2021, our aggregate retail popularity framework showed an especially pronounced build-up in MRNA retail crowd's focus already on July 14 (Wed) and July 15 (Thu), while the stock moved up over 40% in the days following Wednesday's close:
- Jun'21: Second meme-spike in AMC, started being noticable in our retail popularity records already from May 7, as AMC ticker suddenly started ranking in Top 10 or even Top 3 most popular stocks, while, in weeks prior to that, was typically ranked 50-100. Stocks prices jumped from about $9.5 on May 7 to more than $70 at the begin of June 2021.
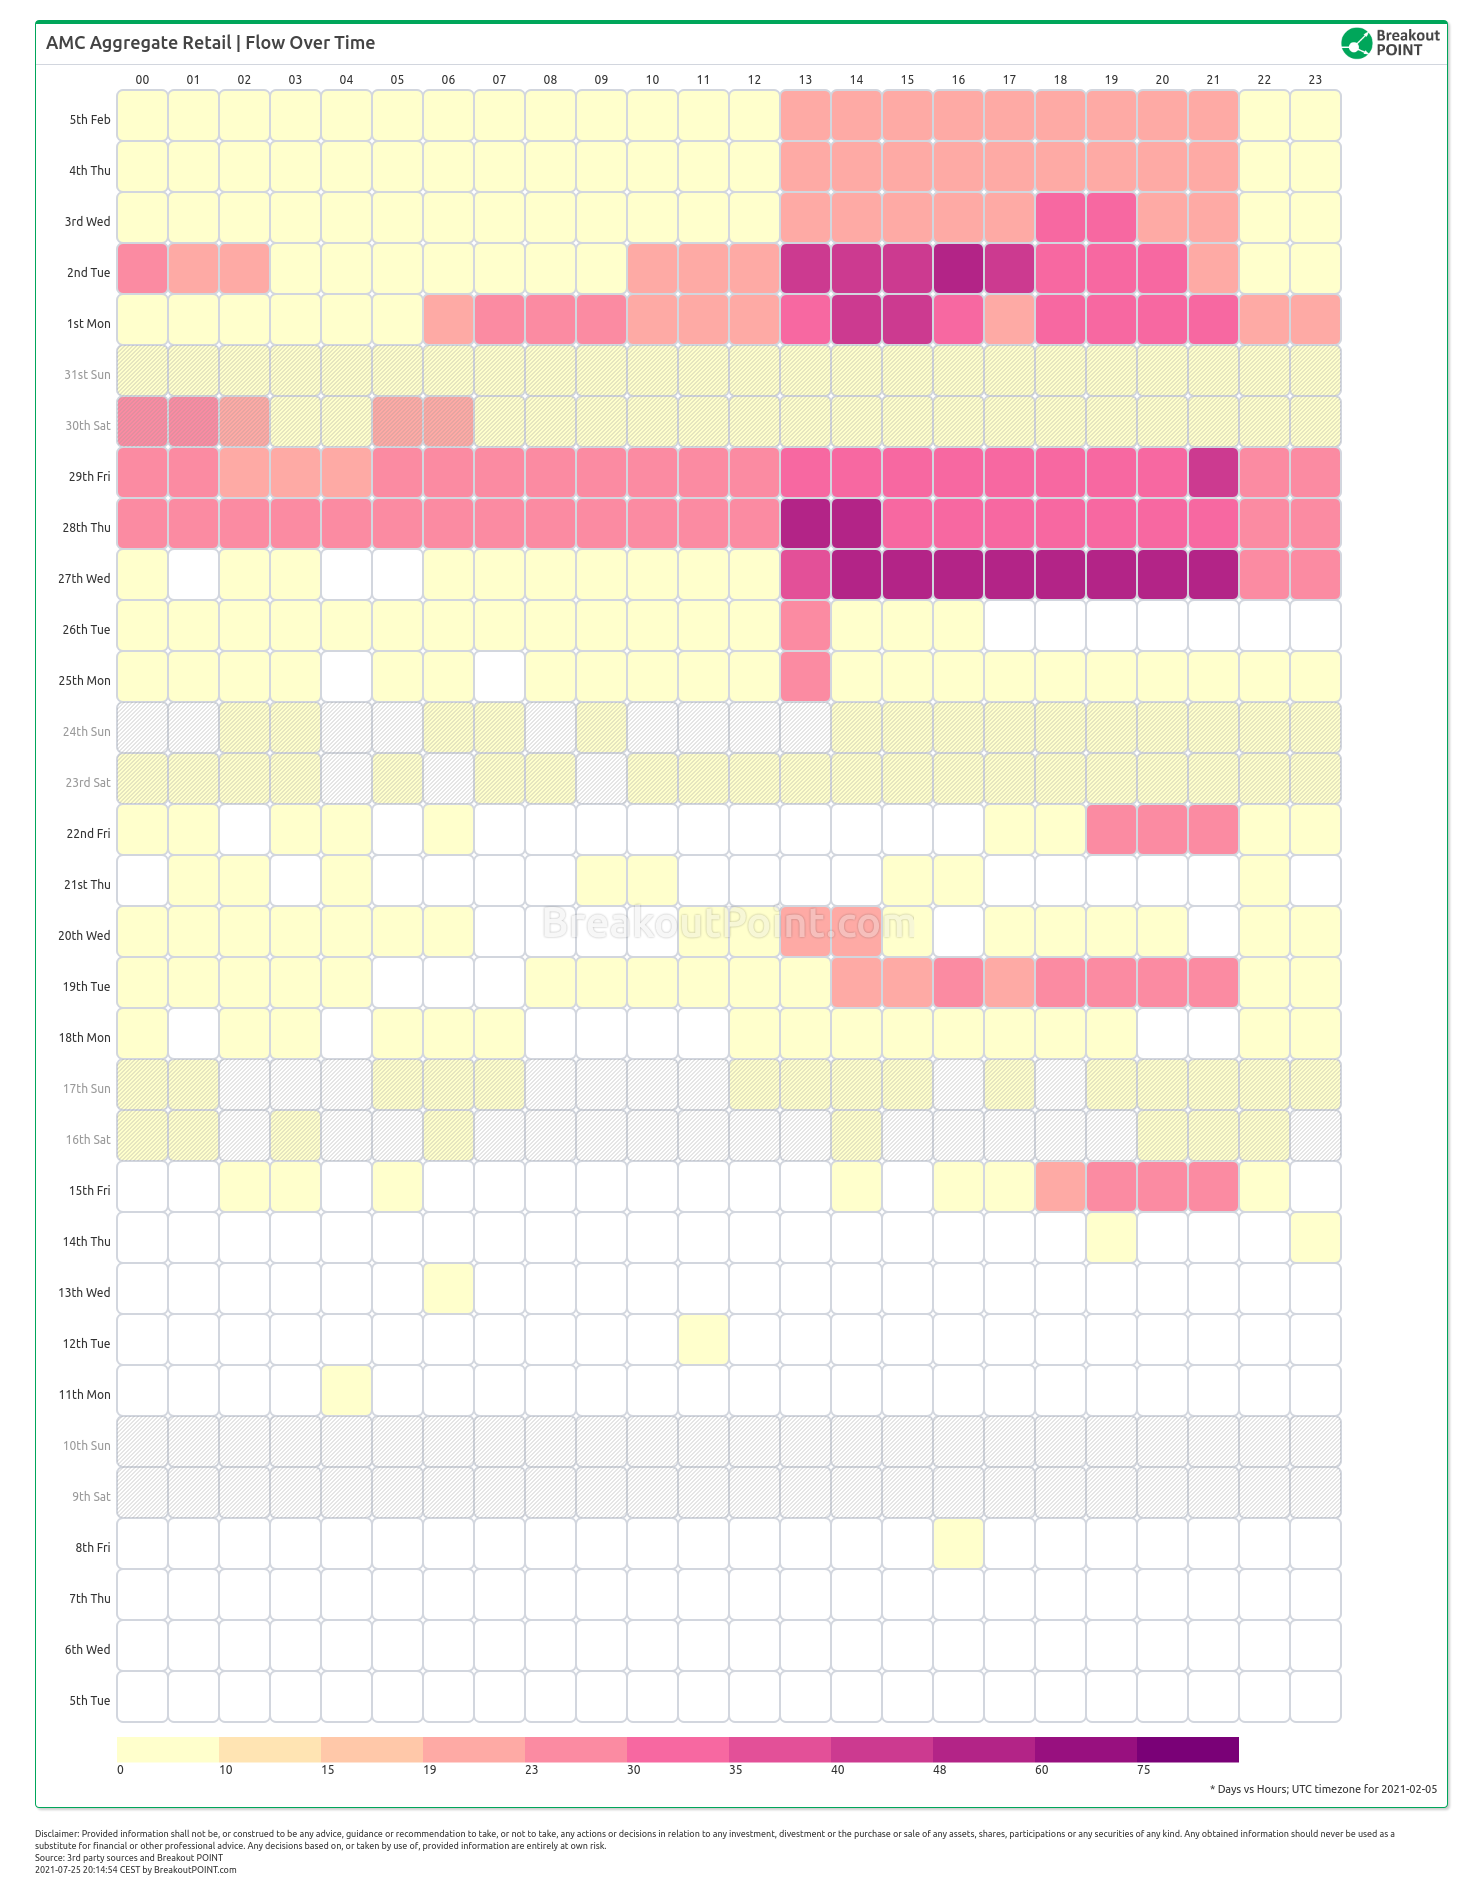
- Jan'21: The original meme-stocks spike. While similar analysis can be conducted for a number of well-known January meme-stocks, such as GameStop, BlackBerry and Nokia, below we focus on AMC. Below heatmap shows that big spike in retail interest has been noticable in our records already from January 15 (daily close $2.33), twelve days before the price spiked to above $20 on January 27.
- Dec'20: Timely recognition of retail popularity of Luminar Technologies following U.S. listing;
- Nov'20: Retail swarming in Chinese-EV stocks and cannabis stocks following U.S. elections;
- Nov'20: Fading of retail popularity in cannabis stocks, that preceded corresponding stock wekness;
- Sep'19: Retail swarming in Nikola after announcement of the deal with General Electric;
- Aug-Sep'19: Stratospheric retail herding in Apple and Tesla on the days of the stock split, which quickly evaporated;
- Sep-Oct'19: Record listing-related retail popularity in Snowflake and Palantir. Far lower corresponding levels in Hyliion.

FAQ | Q: Can I publish parts of above data and analytics in an article? A: As long as you reference our work in your article - yes, you can.
FAQ | Q: Could you provide more related data and analytics? A: Sure, join our Retail Flows plan and start benefiting.
* Note: Unless otherwise stated, presented data and analytics is as of available on 2020-10-31, UTC 13:00.
The services and any information provided by Breakout Point or on the Breakout Point website shall not be, or construed to be any advice, guidance or recommendation to take, or not to take, any actions or decisions in relation to any investment, divestment or the purchase or sale of any assets, shares, participations or any securities of any kind. Any information obtained through Breakout Point and its services should never be used as a substitute for financial or other professional advice. Any decisions based on, or taken by use of, information obtained through Breakout Point and by its services are entirely at own risk.