

Unlock deeper insight into the Saudi equity market with our daily short-selling data solutions. We provide full API access to the dataset as disclosed by the Saudi Exchange’s Aggregate Sum of Net Short Positions framework, enabling you to closely monitor short positioning across the Saudi Exchange. Whether you are an institutional investor, quant fund, risk manager, or research team, our data gives you the transparency you need to understand how short interest evolves across the entire Saudi market.
The Saudi Exchange (Tadawul) publicly reports three key values for every listed company (>260), and we deliver all of them through our API:
- Percentage of Net Short Positions over Outstanding Shares
- Percentage of Net Short Positions over Free Float of Shares
- Ratio of Net Short Positions to Average Daily Traded Volume (Last 60 Days of Trading).
Get our API for the Saudi Exchange Public Disclosures of Aggregate Sum of Net Short Positions. Contact Breakout Point!
Our system ingests, normalizes, and quality-checks these values every day as they are published by the Saudi Exchange (Tadawul), ensuring reliability and consistency across the entire dataset.
Clients can access the data via our API, that delivers data in CSV, XML, and JSON file formats. This dataset is part of our broader suite of short-selling intelligence, including EU/UK short disclosure feeds, activist short selling data and analytics, and our retail investors popularity and sentiment datasets.
As a specialized data and analytics company, we help professional investors transform raw regulatory disclosures into actionable insights. If you’re looking to incorporate Saudi short-selling activity into your models, dashboards, or risk engines, we offer the suitable solution.
If you would like a trial API key or a deeper walkthrough of the dataset, we are happy to help. Contact us at info@breakoutpoint.com or by clicking here.
Sample of our API return in JSON format (CSV and XML are also available):
{
"id": 12227,
"company": "Gulf Insurance Group",
"company_code": "514786",
"isin": "SA12A0540T12",
"symbol": "8250",
"date": "20251113",
"percentage_of_net_short_positions_over_outstanding_shares": "0.00564570",
"percentage_of_net_short_positions_over_free_float_of_shares": "0.01129140",
"ratio_of_net_short_positions_to_average_daily_traded_volume": "0.03523360",
"processed_on": "20251113150705"
}
Why these three disclosed measures together matter
They show different aspects of short activity across the Saudi Stock Exchange (Tadawul):
| Measure | What it tells you |
|---|---|
| % over outstanding shares | How significant the short interest is in the context of the entire company. |
| % over free float | How constrained tradable supply is and how impactful shorts may be on market liquidity. |
| Shorts ÷ average daily volume | How hard it would be for shorts to cover; a pressure/layers-of-liquidity metric. |
Percentage of Net Short Positions Over Outstanding Shares (%)
This shows how much of the company’s total issued shares are currently shorted.
Formula (conceptually):
Net Short Shares / Total Shares Outstanding × 100%
Interpretation:
- A higher percentage means more of the company’s entire share base is being shorted.
- This gives you a sense of the overall short interest relative to every share in existence, not only the tradable ones.
Percentage of Net Short Positions Over Free Float Shares (%)
This measures short interest relative only to the shares available for trading (free float), excluding shares held by governments, founders, or strategic long-term holders.
Formula (conceptually):
Net Short Shares / Free-Float Shares × 100%
Interpretation:
- This is usually higher than the “over outstanding shares” metric because free-float is smaller.
- It’s more meaningful for market dynamics because it reflects how much of the tradable supply is shorted.
Ratio of Net Short Positions to Average Daily Traded Volume (Last 60 Trading Days)
This compares the size of the current net short position to how much stock typically trades each day.
Formula (conceptually):
Net Short Shares / Average Daily Volume (last 60 days)
Interpretation:
- If the ratio is 1.0, the entire short position equals one full day of typical trading volume.
- If 5.0, shorts equal five days of average trading volume.
- Higher values suggest:
- Potential difficulties covering short positions quickly
- Higher risk of short squeezes under certain market conditions
Data Illustration and Practical Insights
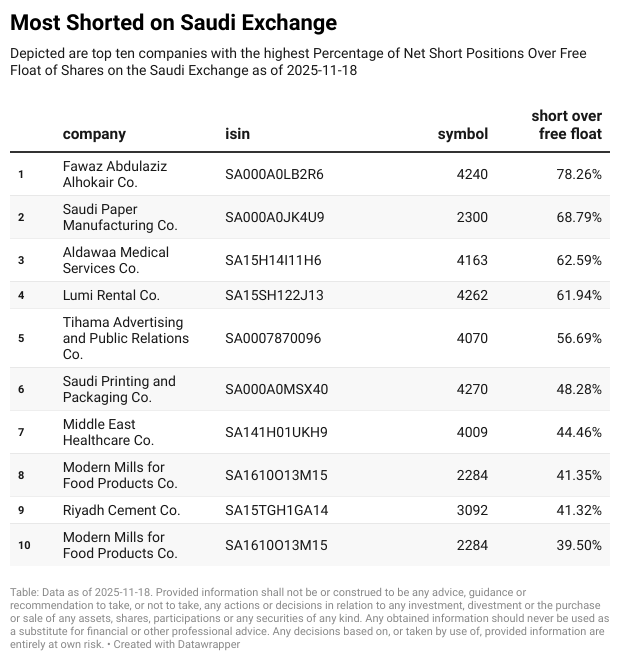
Our API enables you to easily identify the most shorted stocks on the Saudi Exchange by tracking short interest relative to total outstanding shares and to free float:
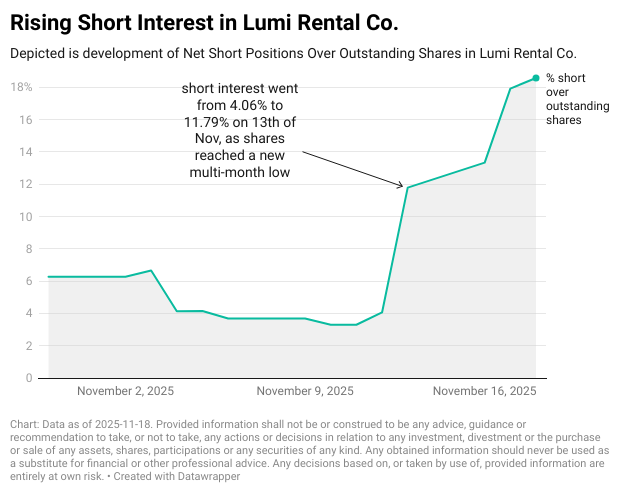
Our API enables you to easily track how short-selling interest evolves over time:
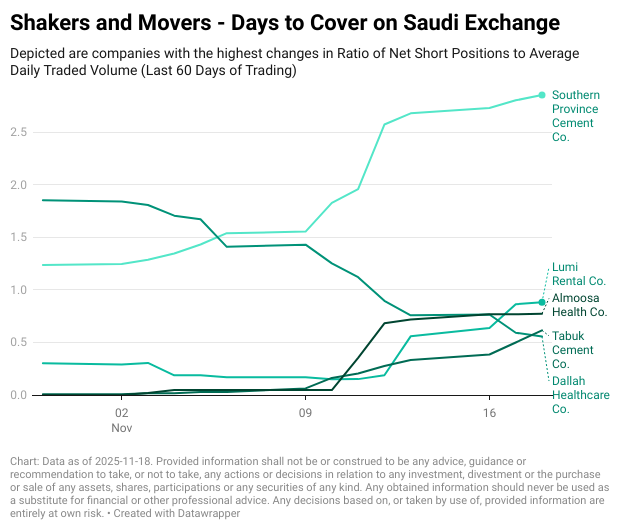
Our API enables you to easily monitor how crowded specific short positions have become and to identify companies with the most rapid changes in days-to-cover and short interest levels:
Get our API for the Saudi Exchange Public Disclosures of Aggregate Sum of Net Short Positions.
Contact us at info@breakoutpoint.com or via our contact form by clicking here.
Note: Presented data and analytics is as of available on 2025-11-18 UTC 18:00. The services and any information provided by Breakout Point or on the Breakout Point website shall not be or construed to be any advice, guidance or recommendation to take, or not to take, any actions or decisions in relation to any investment, divestment or the purchase or sale of any assets, shares, participations or any securities of any kind. Any information obtained through Breakout Point and its services should never be used as a substitute for financial or other professional advice. Any decisions based on, or taken by use of, information obtained through Breakout Point and by its services are entirely at own risk.