

Unlock deeper insight into the Australian equity market with our daily short-selling data solutions. We provide full API access to the dataset as disclosed by the Australian Securities and Investments Commission (ASIC) Short Position Reports framework, enabling you to closely monitor short positioning across the Australian Securities Exchange (ASX) and other ASIC-regulated venues. Whether you are an institutional investor, quant fund, risk manager, or research team, our data gives you the transparency you need to understand how short interest evolves across the entire Australian market.
ASIC publicly reports key values for every listed security, and we deliver all of them through our API:
- Short Position as a Percentage of Total Issued Shares
- Total Net Short Position (number of shares)
- Total Shares on Issue (number of shares)
Get our API for the ASIC Short Position Report Public Disclosures. Contact Breakout Point!
Our system ingests, normalizes, and quality-checks these values every day as they are published by ASIC, ensuring reliability and consistency across the entire dataset.
Clients can access the data via our API, that delivers data in CSV, XML, and JSON file formats. This dataset is part of our broader suite of short-selling intelligence, including EU/UK short disclosure feeds, Saudi Exchange aggregate short positions data, activist short selling data and analytics, and our retail investors popularity and sentiment datasets.
As a specialized data and analytics company, we help professional investors transform raw regulatory disclosures into actionable insights. If you're looking to incorporate Australian short-selling activity into your models, dashboards, or risk engines, we offer the suitable solution.
If you would like a trial API key or a deeper walkthrough of the dataset, we are happy to help. Contact us at info@breakoutpoint.com or by clicking here.
Sample of our API return in JSON format (CSV and XML are also available):
{
"id": 542627,
"company": "ZIP CO LTD",
"company_code": "55025",
"symbol": "ZIP",
"date": "20260331",
"position": "10.09562124",
"position_numeric": "128283402",
"total_shares_numeric": "12706783586",
"processed_on": "20260408110913"
}
Why these three disclosed measures together matter
They show different aspects of short activity across the Australian market:
| Measure | What it tells you |
|---|---|
| % over total issued shares | How significant the short interest is in the context of the entire company — the headline short interest figure. |
| Net short position (shares) | The absolute size of the short position in number of shares, enabling cross-security comparison and position-sizing analysis. |
| Total shares on issue | The full share count underpinning the percentage calculation, allowing you to independently verify and derive further metrics. |
Short Position as a Percentage of Total Issued Shares (%)
This shows how much of the company's total issued shares are currently held as net short positions, as reported to ASIC.
Formula (conceptually):
Net Short Shares / Total Shares on Issue × 100%
Interpretation:
- A higher percentage means more of the company's entire share base is being shorted.
- This gives you a sense of the overall short interest relative to every share in existence, not only the tradable ones.
- ASIC requires daily reporting of all net short positions, making the Australian dataset one of the most granular and timely short-selling disclosures available globally.
Total Net Short Position (number of shares)
This is the raw share count of the net short position — the actual number of shares sold short on a net basis as reported to ASIC, before any percentage conversion.
Formula (conceptually):
Sum of all reported net short positions in shares for the security
Interpretation:
- Enables direct comparison of position size across securities regardless of share price.
- Combined with average daily traded volume (available separately), this can be used to derive a days-to-cover metric.
- Useful for detecting absolute changes in positioning that a percentage figure alone might obscure — for example when total shares on issue changes due to corporate actions.
Total Shares on Issue
This is the total number of shares the company has on issue on the reporting date, as used by ASIC to derive the percentage figure.
Formula (conceptually):
Total issued share capital of the company on the reporting date
Interpretation:
- Provides the denominator for independently recalculating or verifying the short percentage.
- Tracking this field over time helps identify corporate actions — rights issues, buybacks, placements — that can cause sudden moves in the short percentage independently of any change in short positions.
Data Illustration and Practical Insights
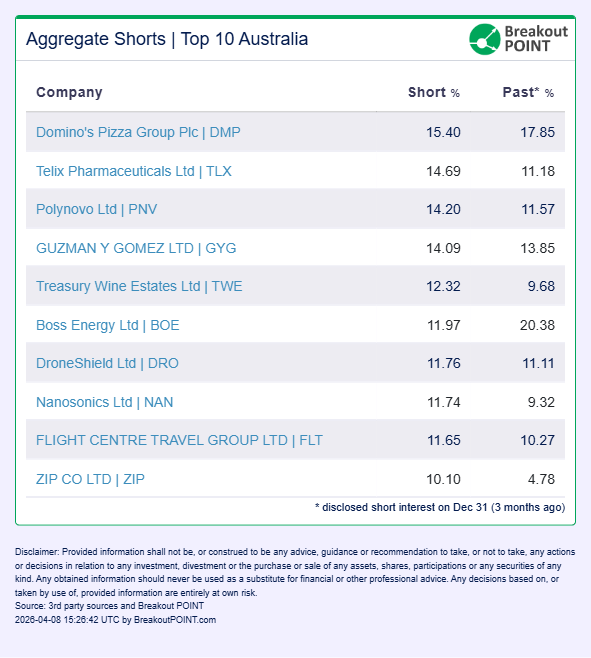
Our API enables you to easily identify the most shorted stocks on the ASX by tracking short interest relative to total issued shares:
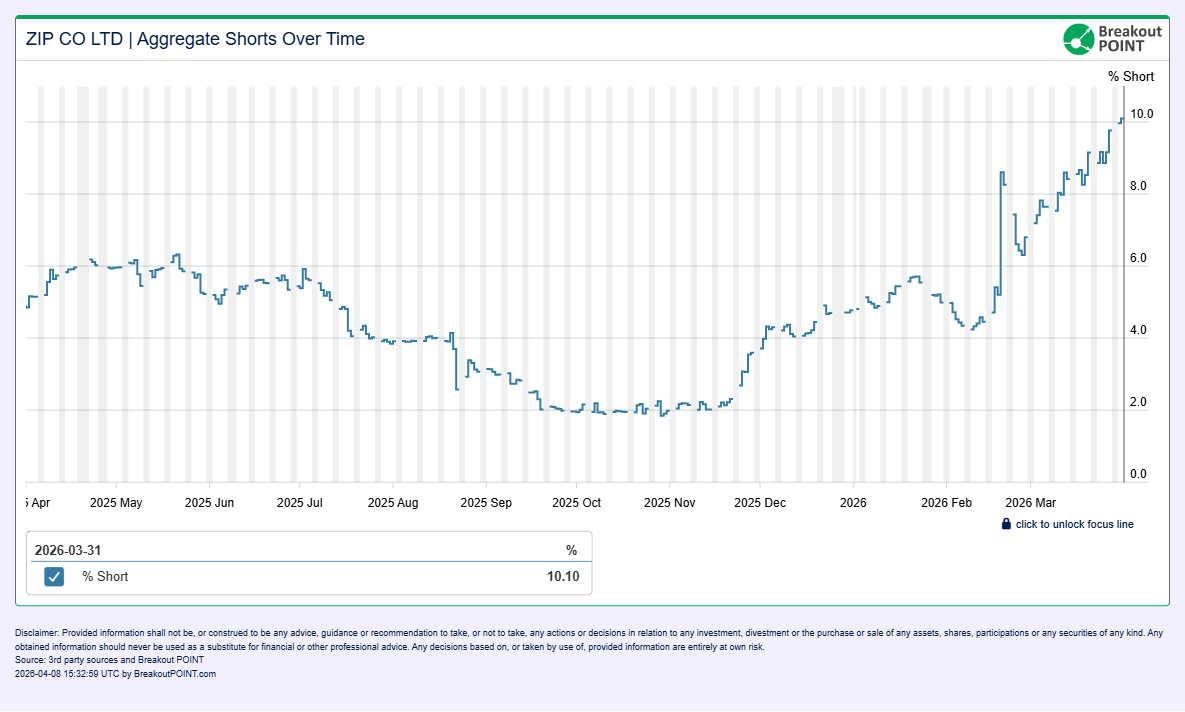
Our API enables you to easily track how short-selling interest evolves over time for individual companies:
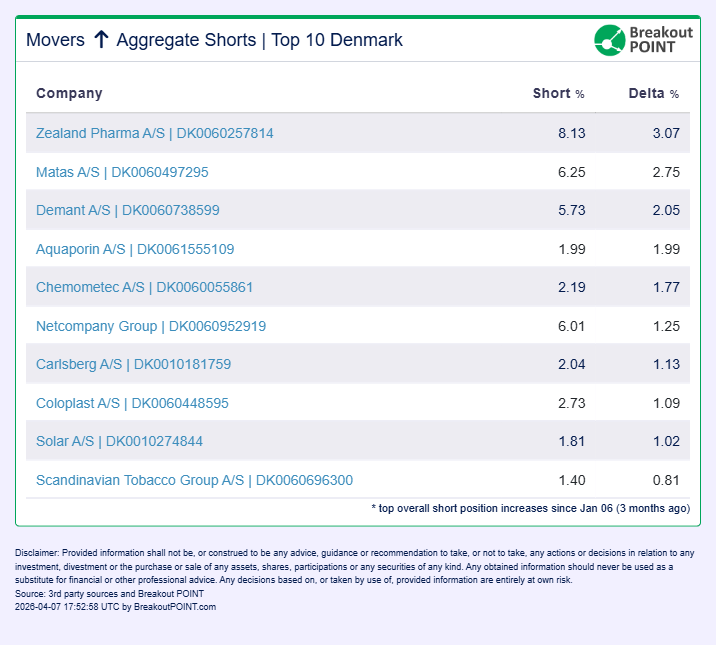
Our API enables you to easily monitor percentage or absolute changes in short positions and identify companies with the most rapid movements in short interest levels:
Get our API for the ASIC Short Position Report Public Disclosures.
Contact us at info@breakoutpoint.com or via our contact form by clicking here.
Note: Presented data and analytics is as of available on 2026-04-08 UTC 18:00. The services and any information provided by Breakout Point or on the Breakout Point website shall not be or construed to be any advice, guidance or recommendation to take, or not to take, any actions or decisions in relation to any investment, divestment or the purchase or sale of any assets, shares, participations or any securities of any kind. Any information obtained through Breakout Point and its services should never be used as a substitute for financial or other professional advice. Any decisions based on, or taken by use of, information obtained through Breakout Point and by its services are entirely at own risk.