

The UK's new short-selling disclosure regime is live — and it has already revealed a substantial layer of short interest that was previously invisible to the market. With our daily short-selling data solutions, we provide full API, dashboards and email alerts access to the FCA's Aggregate Net Short Positions (ANSP) dataset, published each working day under the Short Selling Regulations 2025 (SSR 2025). In this post we take a first look at what the new data shows — and how it compares with what the market could see under the previous regime.
Under SSR 2025, in force since 13 July 2026, individual named short positions are no longer publicly disclosed in the UK. Instead, the FCA publishes an anonymised aggregate net short position per company, covering all positions notified at or above the 0.2% threshold — a substantially wider net than the previous public regime, which only revealed individual positions at or above 0.5% with the position holder's name.
We ingest, normalize, and quality-check the ANSP data every day as it is published by the FCA, and deliver it via our API in CSV, XML, and JSON file formats — alongside our EU short disclosure feeds, Saudi Exchange and Australian (ASIC) aggregate short data, activist short selling analytics, and retail investor sentiment datasets.
Get our API and/or Dashboards for the FCA Aggregate Net Short Positions (ANSP) Public Disclosures. Contact Breakout Point!
First observations under the new regime: 428 issuers disclosed
As of the first publications under SSR 2025, 428 issuers are disclosed as having an aggregate short interest of 0.2% or higher. These are the twenty most shorted UK companies under the new disclosure regime:
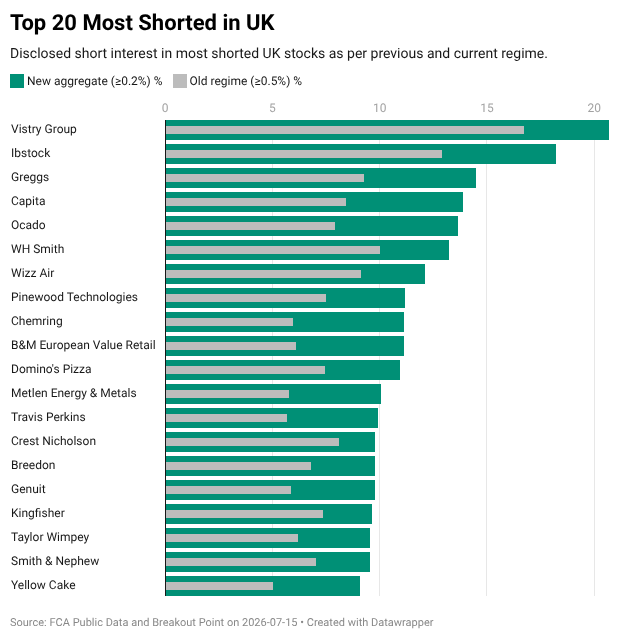
Old regime vs. new regime: how much short interest was hidden?
Because the new aggregate captures every position from 0.2% upward, while the old public feed only revealed named positions at 0.5% or above, the difference between the two figures measures how much short interest was previously sitting below the market's line of sight. The first comparison is striking:
- The typical (median) name on the UK's top 20 most-shorted list was understated by half under the previous regime.
- Adding up the top 20: the market could previously see 159 percentage points of short interest. It now sees 238.
- Put differently, one-third of the significant (≥0.2%) short interest in Britain's most-shorted companies was invisible until Monday.
As the chart above illustrates, with the new aggregate (≥0.2%) shown against the old regime (≥0.5%) figures, the dispersion between individual names is just as interesting as the totals:
| Company | Old regime (≥0.5% named) | New regime (≥0.2% aggregate) | Understatement |
|---|---|---|---|
| Chemring | 5.96% | 11.14% | 87% — the poster child of newly emerged short interest |
| Vistry | 16.81% | 20.68% | 23% — Britain's most-shorted company was also its most honest number |
| Crest Nicholson | 8.10% | 9.78% | 21% — only a fifth hidden; its short base is a handful of large, named, conviction bets |
Chemring is the standout: 5.96% visible via the old ≥0.5% named regime, but 11.14% under the new ≥0.2% aggregate, an 87% understatement. Nearly half of the short interest in the defence group was held in positions individually below the old public threshold, and therefore never appeared in any public feed.
At the other end sits Crest Nicholson: 8.10% before, 9.78% now, only about a fifth was hidden. Even with everything above 0.2% included, its short base remains a handful of large, named, conviction bets rather than a long tail of smaller positions.
Vistry, Britain's most-shorted company at 20.68%, was also its most honest number, only 23% understated under the old regime.
The takeaway for data users: the shape of a company's short base matters. A large gap between the old named figure and the new aggregate signals a crowd of smaller sub-0.5% positions; a small gap signals concentration in a few large holders. Both patterns carry different implications for squeeze risk, covering dynamics, and sentiment analysis, and both are only measurable with the full aggregate data.
A note on the data itself
The new regime's first week also showed that raw regulatory data needs work before it can be trusted. The same file was republished with different contents under the same date, with no changelog. Positions "time-travelled", aggregates revised down with dates rolled back, in one case by two months. Companies vanished from the register without a trace, while the official historical archive logged superseded values for companies that never left and missed the ones that did. Diversified Energy appears twice, under a live and a long-retired ISIN. A few "current" entries dated from 2021–22.
To be fair, these are launch-week issues and publication has stabilised day by day. But they illustrate the general rule: official publication is the start of usable data, not the end.
That's the layer we add: every snapshot versioned, revisions and deletions flagged, issuers de-duplicated, aggregates reconciled against the historical disclosure record. Our dashboards and API show the cleaned, cross-checked view, what the register means, not just what it says today.
Sample of our API return in JSON format (CSV and XML are also available):
{
"id": 395,
"company": "B&M EUROPEAN VALUE RETAIL S.A.",
"company_code": "1583",
"isin": "JE00BVSYJW51",
"latest_position_date": "20260708",
"date": "20260713",
"position": "11.17",
"processed_on": "20260713174905"
}
Our system ingests, normalizes, and quality-checks the ANSP values every day as they are published by the FCA, ensuring reliability and consistency across the entire dataset. Historical named individual disclosures submitted under the previous regime remain available through our separate UK Named Short Positions dataset — giving you the complete picture: named positions up to the regime change, aggregates from then on.
As a specialized data and analytics company, we help professional investors transform raw regulatory disclosures into actionable insights. If you're looking to incorporate UK short-selling activity into your models, dashboards, or risk engines, we offer the suitable solution.
If you would like a trial API key or a deeper walkthrough of the dataset, we are happy to help. Contact us at info@breakoutpoint.com or by clicking here.
Note: Presented data and analytics is as of available on 2026-07-15 UTC 18:00. The services and any information provided by Breakout Point or on the Breakout Point website shall not be or construed to be any advice, guidance or recommendation to take, or not to take, any actions or decisions in relation to any investment, divestment or the purchase or sale of any assets, shares, participations or any securities of any kind. Any information obtained through Breakout Point and its services should never be used as a substitute for financial or other professional advice. Any decisions based on, or taken by use of, information obtained through Breakout Point and by its services are entirely at own risk.